
Page 45 - Industrial Plant 2020
P. 45
NO NO2 NOx NH3 HCL HF SO Dust
2
mg/Nm3 mg/Nm3 mg/Nm3 mg/Nm3 mg/Nm3 mg/Nm3 mg/Nm3 mg/Nm3 UM
29,44 0,99 46,04 0,56 0,02 0,00 0,00 0,16 Average
70,00 5,00 5,00 2,00 10,00 5,00 Limit
Table 1: Emissions at stack (11% O2 dry) measured during Performance Test.
detailed analysis of the noise sources, mapping the silencers and soundproofed booths, ensured that test
sound pressure level at the perimeter of the plant values in the 40 measuring points identified during the
(using 40 measuring points and found over 50 sound design phase complied with the theoretical
sources). assumptions, following installation of the entire plant.
During the first analysis, the engineers identified (on The team also extended acoustic insulation to all
project drawings) over 50 sound sources inside the Redler transport systems, exhaust ducts from the De
plant and 40 measuring points along the perimeter, NOX extractor fan and other small sound sources to
positioned at intervals of ~ 5 m, and at a height of 1.5 achieve the final objective at the fence. Figure 1: Sound
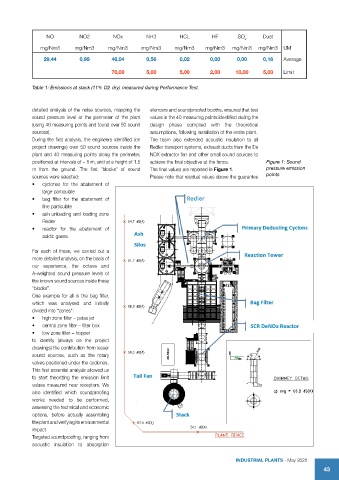
m from the ground. The first “blocks” of sound The final values are reported in Figure 1. pressure emission
sources were selected: Please note that residual values above the guarantee points
• cyclones for the abatement of
large particulate
• bag filter for the abatement of
fine particulate
• ash unloading and loading zone
Redler
• reactor for the abatement of
acidic gases.
For each of these, we carried out a
more detailed analysis, on the basis of
our experience, the octave and
A-weighted sound pressure levels of
the known sound sources inside these
“blocks”.
One example for all is the bag filter,
which was analysed and initially
divided into “zones”:
• high zone filter – pulse jet
• central zone filter – filter box
• low zone filter – hopper
to identify (always on the project
drawings) the contribution from lesser
sound sources, such as the rotary
valves positioned under the cyclones.
This first essential analysis allowed us
to start theorizing the emission limit
values measured near receptors. We
also identified which soundproofing
works needed to be performed,
assessing the technical and economic
options, before actually assembling
the plant and verifying its environmental
impact.
Targeted soundproofing, ranging from
acoustic insulation to absorption
IndustrIal Plants - May 2020
43