
Page 71 - Industrial Plant 2020
P. 71
Blocks description:
f1: Pressure, Temperature flow compensation
f2: Density compensation to obtain real fuel flow.
f3: Correction with low calorific value. Output of block represent
the “thermal energy equivalent” natural gas flow
f4: Density – Low heat calorific value curve
f5: Air demand curve based on density
f6: Air demand correction
Figure 12- Typical DCS block diagram for hydrogen
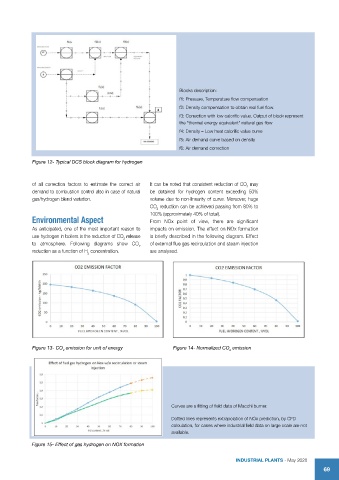
of all correction factors to estimate the correct air It can be noted that consistent reduction of CO may
2
demand to combustion control also in case of natural be obtained for hydrogen content exceeding 50%
gas/hydrogen blend variation. volume due to non-linearity of curve. Moreover, huge
CO reduction can be achieved passing from 80% to
2
100% (approximately 40% of total).
Environmental Aspect From NOx point of view, there are significant
As anticipated, one of the most important reason to impacts on emission. The effect on NOx formation
use hydrogen in boilers is the reduction of CO release is briefly described in the following diagram. Effect
2
to atmosphere. Following diagrams show CO of external flue gas recirculation and steam injection
2
reduction as a function of H concentration. are analysed.
2
Figure 13- CO emission for unit of energy Figure 14- Normalized CO emission
2 2
Curves are a fitting of field data of Macchi burner.
Dotted lines represents extrapolation of NOx prediction, by CFD
calculation, for cases where industrial field data on large scale are not
available.
Figure 15- Effect of gas hydrogen on NOX formation
IndustrIal Plants - May 2020
69